
Simulation of organic acid migration and transformation in Mangrove soils based on soil column experiments

Establishment of organic acid standard curve
The six organic acid standards were effectively separated by RT-HPLC when 10 µL of organic acid control samples of different mass concentrations were aspirated into the sample. A linear regression was performed on the peak area Y with the mass concentration X of organic acid standards, and the correlation coefficient R2 of the regression equation ranged from 0.9975 to 0.9999, which indicated that a variety of organic acids could be detected at the same time by adopting the chromatographic conditions of RT-HPLC.
Results of soil column experiments

Plot of conductivity and water content versus temperature for soil column experiments.
The water content, temperature and conductivity of the soil column device were monitored during the experiment using the ECH2O soil monitoring system, and a total of 76,758 records were recorded with Port1, Port2 and Port3 representing the monitoring of the upper, middle and lower monitoring positions. The monitoring results were shown in Fig. 3, which showed that the water content of the soil column decreases gradually from the top to the bottom, while the water content at the same position remains relatively stable. The results of the conductivity showed that the deeper the subsoil, the lower the total dissolved solids content, which coincided with the results of the water content. the results of the temperature monitoring showed that the maximum temperature difference at the same depth in the course of the experiment of the soil column is 3.7 °C, which is related to the weather condition. The maximum temperature difference at the same time was 2.5 °C, which was caused by the fact that the upper layer of the subsoil is more likely to receive heat from the environment. The deeper the layer, the lower the efficiency of heat transfer in the subsoil.
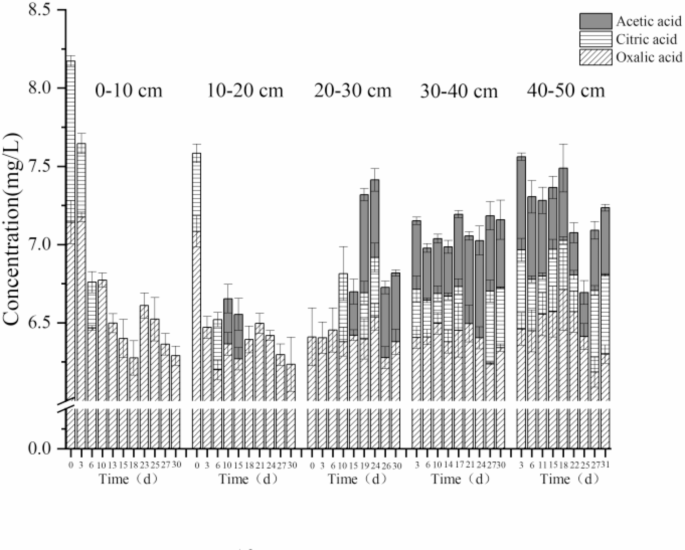
Plot of organic acids with time at different depths.
By sampling the effluent from the side outlet of the soil column device and using high performance liquid chromatography to determine the content of organic acids therein, the types and concentrations of organic acids in the substrate at different depths were obtained and varied with time as shown in Fig. 4. The results of the soil column experiments showed that oxalic acid was the most widely distributed and stable organic acid under different spatial and temporal changes, with concentrations ranging from 6.3 to 7.5 mg/L. The concentration of citric acid in the shallow substrate was higher than that in the deep substrate at the beginning of the experiment. As the experiment proceeded, the concentration of citric acid in the 0–20 cm soil gradually decreased to 0 mg/L, while the concentration of citric acid in the 20–30 cm soil first increased from 0 to 0.32 mg/L, and then decreased to 0 mg/L. When it comes to the 30–40 cm soil, the concentration of citric acid increased from 0 mg/L to 0.39 mg/L, and the concentration of citric acid in the 40–50 cm soil increased from 0 mg/L to 0.50 mg/L, indicating that citric acid adsorption and sedimentation occurred in the substrate of the mangrove wetland. Acetic acid was not detected in the initial experiment, as the experiment progressed, the content of acetic acid in the deeper substrate of 30–50 cm gradually increased from 0 to 0.44 mg/L until it remained stable, indicating that the organic matter present in the substrate, such as fish and shrimp carcasses, bait from shrimp ponds, and excreta, etc., would undergo an anaerobic reaction to produce acetic acid in the anaerobic environment.
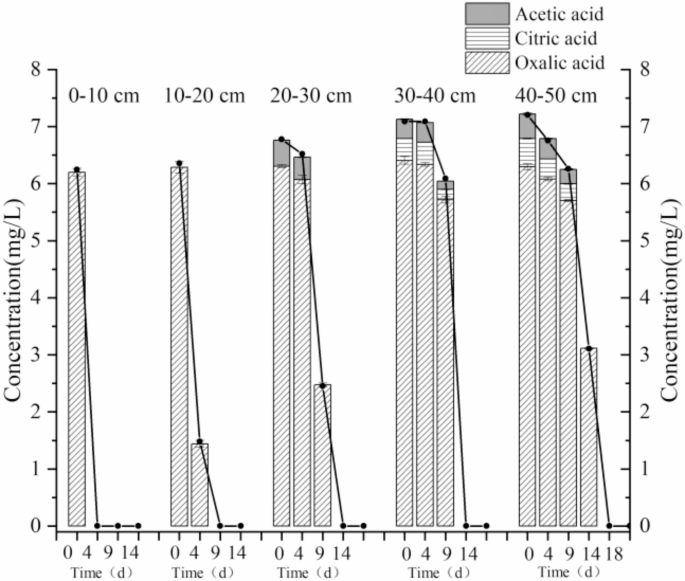
Plot of organic acids with time after adding Ca(OH)2.
The changes of organic acids after adding Ca(OH)2 are shown in Fig. 5. The concentration of Ca(OH)2 used in the simulation was 1.84 g/L, which was the discharge concentration during the dredging of shrimp ponds. This concentration was much higher than the content of organic acids in the substrate, so the organic acids were immediately neutralised when Ca(OH)2 diffused to different depths, and the rate-limiting factor for the reduction of organic acids at this time mainly depended on the Ca(OH)2 diffusion rate in the substrate. The organic acids in the 0–10 cm soil were completely neutralized on the 4th day, while the organic acids in the 40–50 cm soil were completely neutralized on the 18th day. Therefore, the calculated permeation rate of Ca(OH)2 molecules was approximately 50/18 = 2.8 cm/d, indicating that the pores in the mangrove sediment were small and the permeability was poor, resulting in a slower permeation rate of Ca(OH)2 molecules. After the neutralisation of organic acids in the 40–50 cm sediment, excess hydrochloric acid was added to the effluent, and the organic acids were detected by RT-HPLC. The total amount of organic acids in the effluent was 6.7 mg/L, while the total amount of each organic acid was 7.2 mg/L after the end of the anaerobic acidification, which indicated that the organic acids mainly existed as insoluble or slightly soluble precipitates of calcium organic acids after the addition of Ca(OH)2.
Model fitting results
The soils catalog item in the HYDRUS-1D water flow module contains 12 typical soil media such as sandy soil, silt, clay and other soil moisture characteristic curve related parameters. According to the column filled with soil media and the neural network prediction function in HYDRUS-1D17, adjusted to speculate the moisture Characteristic parameters in the subsoil, θr, θs, α, n, Ks, and l were 0.074 m3/m3, 0.355 m3/m3, 0.5 m−1, 1.09, 0.01 m/d, and 0.5, respectively, where the smaller Ksindicated the worse ability of water transport in the soil18.
In the parameter setting for solute transport, c was entered as the concentration of organic acids in the 10 cm subsoil at each sampling point19, where the partition coefficient of organic acids in the solid phase was 0.04; the integrated dispersion coefficient D was calculated according to the formula: D = 2.71 × 10⁻⁴/M0.71, with M being the molar mass of the solute, and the smaller the value of D indicated the poorer ability of the soil to transport the substance. The reaction rate constant was 1.8 × 10⁻⁴.
The upper boundary of solute transport was selected as the concentration flux boundary according to the actual situation, and the lower boundary was selected as the zero-concentration gradient boundary without considering the background value of organic acid in soil, and at the same time, the concentration of the liquid phase was selected as the initial condition of the model, and five observation points were uniformly distributed from the top to the bottom of the term.
The initial time step was set to be 0.1 d, and the minimum and maximum time steps were 0.01 d and 10 d, respectively; the permissible deviations of soil water content and pressure head were 0.0005 cm and 1 cm, respectively, and the pressure head was set to be 1 m. The simulation duration of this experiment was 1 a.

Comparison of simulated and measured values of oxalic acid and acetic acid in the bottom mud.
The set parameters were used to predict the concentrations of oxalic acid and acetic acid at the depths of 0–10 cm, 10–20 cm, 20–30 cm, 30–40 cm, and 40–50 cm, and the actual measured concentrations were compared with those of oxalic acid and acetic acid, as shown in Fig. 6.
The simulation accuracy of the model was evaluated using the coefficient of determination (R2) and standard error (RMSE) based on the validation of soil measured soil oxalic acid concentration against the simulation results17. The R2 and RMSE thresholds ranged from 0 to 1, where the larger the value of R2 and the smaller the value of RMSE, the higher the simulation accuracy. The simulation accuracies are shown in Tables 1 and 2, the R2 between the measured and simulated values of oxalic acid content in the substrate is between 0.8 and 0.9, and the RMSE is between 0.014 and 0.034. R2 between the measured and simulated values of acetic acid content in the substrate is between 0.7 and 0.9, and the RMSE is between 0.013–0.019.The simulated values of the simulation and the measured values are in a higher degree of agreement, and the results of the model simulation can be better compared to the measured values. The model simulation results can better reflect the dynamic change characteristics of soil organic acids in each treatment. Moreover, the monitoring results showed that the temperature and humidity changes under laboratory conditions had little effect on the temperature and moisture of the soil column.
According to the neural network prediction function, Ks was 1.01 cm/d, which was lower than the permeation rate of Ca(OH)2. The diffusion coefficient of oxalic acid was 0.111 cm2/d, and the diffusion coefficient of acetic acid was 0.148 cm2/d, which indicated that the vertical mobility of water and organic acid in the subsoil during the experiment of the soil column was relatively poor, and the subsoil had a strong adsorption capacity of organic acid, so that the concentration of organic acid in the subsoil in each level remained relatively stable, the overall potential contamination distribution pattern of organic acids was shown to be consistent.
Microbial sequencing results

Heatmap of distribution at species level.
The heatmap of species distribution of the top 30 species with the highest relative abundance at different stages during the soil column experiment is shown in Fig. 7. As a widely distributed microorganism in soil, Woeseiacan not only synthesize some compounds that are beneficial to plant growth21but also help to maintain the structure and water balance of the soil22. Sulfurovumhas the capacity to oxidize sulfur, which played a key role in the sulphur cycle that can interact with iron and sulphides, leading to the precipitation and formation of minerals23. It can be inferred that the significant enrichment of Woeseia and Sulfurovumplayed an important role in maintaining ecosystem health. Their indispensable ability can provide essential substances for mangrove forests and contribute to the material cycling of ecosystem24,25, which is beneficial for maintaining ecosystem health.
The most obvious change in the whole process was Acinetobacter Johnsonii, which has the ability to produce acids and can degrade large organic molecules to produce organic acids, such as gluconic acid, acetic acid, amino carboxylic acid in various environments26,27. Its abundance increased after stabilization of the anaerobic phase, and finally disappeared after the addition of Ca(OH)2 solution, which coincided with the process of acetic acid change detected by HPLC.
link


.jpg "IFW Dresden selects Agnitron Agilis 100 MOCVD platform for precursor chemistry and ultra-wide-bandgap materials development")