


Structural properties
As a common practice for the validity of the force field, hence the simulation results, we simulated the liquid density (ρ) and the surface tension (γ). A good agreement was concluded between these results and the experimental data (for pure [C4mim][PF6], γ = 47.50 mJ/m2 and ρ = 1.36730 g/cm3; for pure BZN, γ = 38.33 mJ/m2 and ρ = 1.00069 g/cm3 at 298 K)8,55,56, with deviations not more than 1.2%, 3.45% and 2.71%, 7.06%, respectively.
Intermolecular correlations in the binary mixture ([C4mim][PF6] + BZN) were analyzed using radial distribution functions (RDFs). Figure 2 shows correlation functions between the center of mass (COM) of cations, anions, and BZN molecules. The first peak of the cation⋯anion correlation function remains consistent (~ 0.47 nm) across mixtures, with peak heights in the order of XBZN= 0.0 < 0.1 < 0.3 < < 0.5 < 0.7 < < 0.8 < < 0.9. These short-range correlations highlight the strong effectiveness of cation⋯anion electrostatic interactions across all XBZN values. Increasing XBZN enhances IL segregation into ion pairs (synergy), where synergy indicates a collective effect surpassing individual impacts57. The ionic nature of ILs promotes local order in cation⋯anion interactions and long-lived clusters, leading to predominant cation⋯anion correlations (see Fig. 2a versus b, c).
Interionic interactions in the IL are influenced by its molecular configuration and can be analyzed using a mixture of a given mole fraction. Cation⋯cation (C⋯C) and anion⋯anion (A⋯A) correlations are weaker than cation⋯anion (C⋯A) interactions, which exhibit strong electrostatic attraction due to opposite charges. The first peak heights in C⋯C and A⋯A RDFs (Fig. 2b, c) mirror trends in A⋯C but with reversed correlation order between 0.5XBZN and 0.8XBZN; C⋯C and A⋯A correlations are stronger at 0.5XBZN than 0.8XBZN. No detectable changes are seen in C⋯C and A⋯A correlations at low mole fractions (up to 0.3XBZN). This correlation shift with XBZN correlates with density transitions at 0.3 and 0.7, with a minimum at 0.5 (see sec. Inter-dynamic properties). Two transitions occur near the equimolar fraction (0.5XBZN), at 0.3XBZN and 0.7 XBZN. The first peak heights of C⋯C and A⋯A RDFs increase with XBZN. The first peak positions of A⋯A, C⋯C, and A⋯C (at ~ 0.94, 0.9, and 0.47 nm, respectively) indicate C⋯A is the strongest correlation across all mole fractions. C⋯C and A⋯A correlations should be viewed as peripheral.
The correlations involving BZN (i.e., A⋯BZN, C⋯BZN, and BZN⋯BZN) are illustrated by the RDFs in Fig. 2d–f, respectively. Systematic changes exist in the trend of first peak height for low \(\:X_\textB\textZ\textN\)(= 0.1, 0.3, and 0.5) and high \(\:X_\textB\textZ\textN\)(= 0.7, 0.8 and 0.9). Accordingly, the correlation between IL and BZN molecules is more prominent at lower \(\:X_\textB\textZ\textN\) and decreases with increasing \(\:X_\textB\textZ\textN\). Overall, the IL and BZN correlate in the order of A⋯BZN \(\:>\) BZN⋯BZN \(\:>\) C⋯BZN in all the mixtures.
The BZN⋯BZN and C⋯BZN RDFs show the first peak position slightly at more considerable distances (typically \(\:\sim\:\)0.62 nm and \(\:\sim\:\)0.68 nm, respectively) than those of A⋯BZN (\(\:\sim\) 0.56 nm). The smaller size of the anion than the cation may account for this. Here, shoulders are observed for BZN⋯BZN RDFs at \(\:\sim\:\)0.40 nm at all XBZNs (Fig. 2f), consistent with the distance of the closest approach for BZN⋯BZN in stacking mode (as previously studied for pure liquid BZN20). This shoulder first appears at 0.1XBZN mixture, more than at other XBZN levels. Thus, numerous IL ions promote BZN segregation at 0.1XBZN, forming small BZN⋯BZN aggregates in stacking mode through synergistic effects57. The first peak height at 0.5XBZN exceeds other fractions, with its shoulder more prominent. Since these RDFs are based on the COM of each molecule and BZN’s COM is on its planar moiety, taller peaks represent more substantial stacking structures. The 0.5XBZN mixture enhances synergistic interactions, optimizing bulk interactions involving A⋯BZN, C⋯BZN, and BZN⋯BZN.

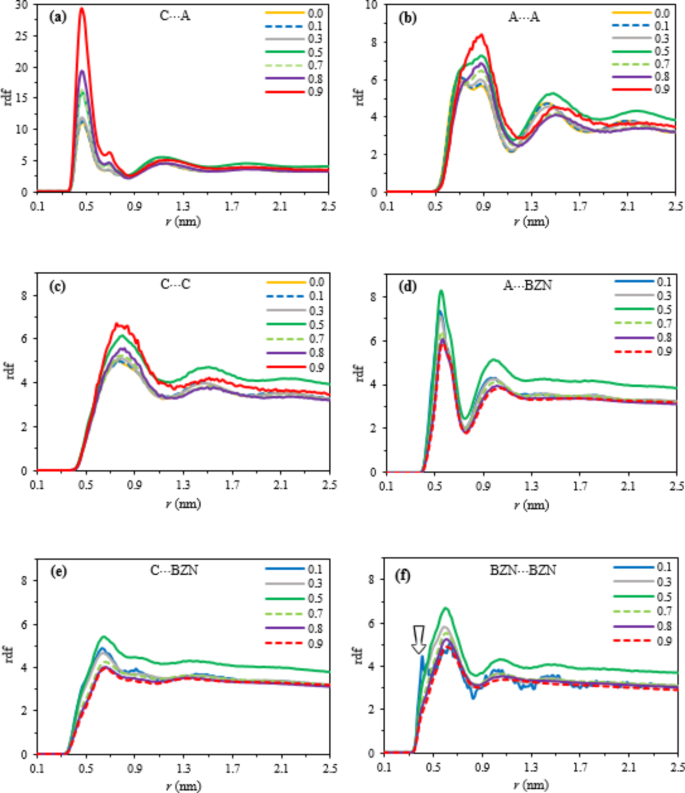
Centre of mass RDFs for (a) cation⋯anion (C⋯A), (b) anion⋯anion (A⋯A), (c) cation⋯cation (C⋯C), (d) anion⋯benzonitrile (A⋯BZN), (e) cation⋯benzonitrile (C⋯BZN), and (f) benzonitrile⋯benzonitrile (BZN⋯BZN) for different \(\:X_\textB\textZ\textN\) in the bulk solution.
The ortho, meta, and para H-atoms of BZN molecules and anion F-atoms form hydrogen bonds. Figure 3a shows RDFs between ortho-H atoms and one anion F atom, indicating hydrogen bonding at ~ 0.27 nm. Van der Waals forces predominate in interactions between the butyl chains of the cations, as shown by the correlation between the butyl terminal C atoms in Fig. 3b, c. A systematic effect of BZN concentration is evident in Fig. 3a–c. Hydrogen bonding between BZN’s N-atoms and cation H-atoms is depicted in Fig. 3d for 0.5XBZN, with the most intense peak at ~ 0.27 nm, consistent across other XBZN values (not shown). Figure 3d color codes illustrate the probability of hydrogen bonding, ranked as H1–H3 (imidazole ring) > H13–H15 (methyl group) > H4–H5 (methylene group) > H6–H12 (butyl tail), as labeled in Fig. 1. Hydrogen atoms nearer the imidazolium head group strongly correlate with BZN’s N atom. This N⋯(H1–H3) correlation persists until the second peak, highlighting the importance of head-group interactions.
Further structural analysis examines correlations between C14 (para C) and C11 with the cation C and N atoms, as shown in Fig. 3e. The sharpest peaks represent the C14 and C7 (butyl tail C) correlation. Other correlations, persisting in the second shell, involve C11 with C8 (methyl C), N1 and N2 (imidazole ring N’s), and C4 (methylene C). These findings indicate BZN molecule aggregation and the formation of stacked configurations. Simultaneously, the BZN aromatic ring interacts with the cation alkyl, while its C≡N group interacts with the H atoms of the imidazolium ring.


Site-site RDFs in the different mixtures for (a) ortho-H⋯F, (b,c) C(butyl tail)⋯C(butyl tail). Also, correlations are shown in (d) for N(BZN)⋯H(cation) and (e) for C(BZN)⋯C and N(cation) at 0.5\(\:X_\textB\textZ\textN\) mixture. See Fig. 1 for the atoms’ labels.
Further insights were gained by analyzing the spatial distribution functions (SDFs) of ions around BZN molecules at 0.5\(\:X_\textB\textZ\textN\) using TRAVIS software58, as shown in Fig. 4. The anionic cloud-primarily envelops the H-atoms of BZN, especially ortho-H, suggesting potential H-bond formation with the F-atoms of the anion (Fig. 4a). Conversely, the anion repulsively interacts with the C≡N group, occupying the rear side. Similarly, cationic clouds exhibit spatial distribution around the C≡N group, attributed to H-bonding between the N-atom of BZN and the H-atoms of the cation, particularly those in the imidazole ring. Consistent with RDFs in Figs. 3d and e and 4b shows the extension of BZN molecules’ cloud around the cation butyl chain.


SDFs at 0.5\(\:X_\textB\textZ\textN\) for (a) the cation (red) and the anion (blue) around the BZN molecule. (b) SDF of the BZN molecules around the cation. (c) Color coding illustration for cation, anion, and BZN molecule.
Coordination and energy profiles
The coordination number (CN), calculated via correlation functions, describes the relative structure of mixture components. CN values for cation–anion, BZN–anion, BZN–cation, and BZN–BZN interactions were determined using TRAVIS package58 across XBZN (Table 2). As XBZN increases, the CN for cation–anion pairs decreases, while it rises for BZN around cations, anions, and other BZN molecules. This suggests BZN molecules position themselves between anions and cations, forming BZN–cation stacking structures and hydrogen bonds with anions, consistent with planar and stacked clusters in molecular dynamics simulations of pure benzonitrile20. In mixtures with XBZN from 0.3 to 0.7, the cation-anion CN remains constant at 3. However, RDFs (Fig. 2a) identify them by suggesting a lower cation-anion dynamics as XBZN increases. In the mixture with XBZN = 0.9, the ILs interact with CN = 2, indicating that low-mole-fraction ILs segregate into highly probable clusters containing ~ 2 ILs. This perspective also applies to the CN calculated for BZN–BZN, although a BZN molecule across the mixtures may coordinate with 2–13 other BZN molecules. Interestingly, the coordination numbers of IL⋯IL and BZN⋯BZN are almost identical in the equimolar mixture, which supports the likelihood of BZN stacking on the alkyl chain in this mixture. This also satisfying when other CN’s are compared across Table 2 at equimolar mixture.
To investigate the solvation energetics of adding BZN to the IL, the trends in potential, Lennard-Jones (LJ), and total energies were calculated for mixtures at different XBZN. Figure 5 shows that adding BZN to the ionic liquid increases the potential energy (more positive), steadily decreases the LJ energy (more negative), and keeps the kinetic energy constant. Overall, adding BZN to the IL reduces cation-anion electrostatic interactions and increases the total energy (more positive). Notably, at XBZN = 0.5, there is an approximate balance between the total and LJ energies.


Variation of the different energy across the mixtures of \(\:\left[\textC_4\textm\texti\textm\right][\textP\textF_6]\) and BZN.
Spatial orientation
Spatial interactions between BZN and IL were examined using combined distribution functions (CDFs), integrating radial and angular distributions via the TRAVIS package58. Supplementary Figure S1-A shows CDFs for cation alkyl chains interacting via van der Waals forces. The most probable orientations occur around 0.42 nm, corresponding to distances between butyl terminal C atoms (C7), as discussed earlier (Fig. 3b). Alkyl butyl chains primarily form angles of ~ 60° and 180°, with less frequent orientations at ~ 0.5 nm and ~ 0.94 nm with θ ~ 0°, closely matching average distances of butyl tail atoms (C6 in Fig. 3c), shown schematically in Supplementary Fig. S1-B .
Supplementary Figure S1-A also compares mixtures with similar structures, where orientations at XBZN (= 0.3 and 0.5) appear with the same intensity as 0.0XBZN but with narrower distributions. Visual comparison confirms the 0.5XBZN mixture is structurally well-defined from a co-solvent perspective, with BZN inducing interactions that create well-organized BZN + IL structures. Further stabilization is possible through synergy, confirmed by the contraction (lowering density) of the mixture at 0.5XBZN.
The angular distribution of BZN molecules around the cation was studied using the schemes in Fig. 6a, b at 0.5XBZN and Supplementary Fig. S2 at various XBZN levels. Figure 6a and Supplementary Fig. S2-Aa–f help analyze these distributions, mainly through the (angle-length) correlation between the cation’s butyl chain and BZN’s ring. The CDFs show two contours at angles θ = 0° and 180°, centered around 0.42–0.5 nm (Fig. 3e). These patterns suggest BZN (\(\:\uparrow\:)\) interacts with IL \(\:(\uparrow\:\)) in parallel (\(\:\uparrow\:\uparrow\:\)), antiparallel (\(\:\uparrow\:\)↓), or a combined (↓\(\:\uparrow\:\uparrow\:\)) mode. The latter indicates BZN molecules on the alkyl chain (at 0° or 180°), where the C≡N group may form an H-bond with the imidazole ring. At lower XBZN (0.1, 0.3, 0.5), the probability of these configurations increases, while at higher XBZN (0.7, 0.8, 0.9), their population decreases (Fig. 6, Supplementary Fig. S2-A). A broader angle range is seen at high XBZN, while lower values focus on 0° and 180°. These orientations are illustrated in Supplementary Fig. S2-B.


Combined distribution functions (at 0.5\(\:X_\textB\textZ\textN\) mixture) for (a) cation and BZN molecule (in stacking mode), (b) cation and BZN molecule (by H-bond interaction), and (c) anion and BZN molecule. The corresponding IL + BZN interactions are also shown schematically.
The structural analysis focused on possible H-bonding between the C≡N group and the H-atom of the imidazole ring. The most likely orientation at ~ 0.26 nm (Fig. 3d) spans from 100° to 180°, with a higher probability in low XBZN than in high XBZN (Fig. 6b and Supplementary Fig. S2-Ag–l; also see Supplementary Fig. S2-C). The anion, interacting through F-atoms, is found near the H-atoms of BZN due to hydrogen bonding (Fig. 3a). As XBZN increases, the interaction between the anion and BZN (via ortho-H) weakens (Fig. 6c and Supplementary Fig. S2m–r). Probable contour distributions appear at ~ 0.28, 0.48, 0.67, and 0.92 nm, with ~ 0.28 nm most probable from 120° to 180°.
Supplementary Figure S3 shows the CDF of the cation⋯anion pair at various XBZN values. The most probable configuration, around 0.26 nm, corresponds to the distance between the anion (F-atoms) and the cation’s most acidic H-atom, oriented at a 130° angle. At a ~ 1:1 mol ratio, BZN strengthens IL⋯BZN interactions, weakening most cation–anion interactions. RDF, SDF, and CDF analyses confirm BZN molecules stack onto the IL’s butyl tail. The C≡N group interacts with the imidazolium ring (Figs. 3d and 6b, Supplementary Fig. S2-Ag–l), and its para-C atom strongly correlates with the butyl chain’s terminal C (Figs. 3e and 6a, Supplementary Fig. S2-Aa–f). This antiparallel stacking, prominent in neat BZN liquid20, extends to the binary mixture (Fig. 7). Although BZN shows limited correlation with the imidazolium, hydrogen bonding with the H3 atom likely enhances stacking (Fig. 4b). The anion above the imidazole ring interacts via electrostatic forces: one F-atom correlates at ~ 130° with the cation H3 atom, and another forms a hydrogen bond with BZN’s ortho-H atom at ~ 120°–180°, aligning BZN along the cation’s alkyl chain (Fig. 7).


Schematic representation of BZN correlated with IL in a combined parallel-antiparallel stacking mode\(\:(\downarrow\:\uparrow\:\uparrow\:)\). Cations are shown in red, anions in blue, and BZN in green-blue. Note that the three methylene groups participate in the stacking configuration. Hydrogen atoms are omitted for clarity.
Density profiles and SFG evidences
We simulated the surface structure of IL + BZN mixtures to explore the molecular origins of the corresponding experimental SFG vibrational spectroscopy performed earlier45. Three key findings from the experiment are (i) no SFG signal from the IL’s methylene groups and imidazolium ring, (ii) a gradual loss of SFG intensity for the IL −CH3 group, disappearing at 0.5XBZN, and (iii) no SFG signal from the C≡N group in mixtures with XBZN < 0.8. It has been concluded that BZN molecules are more ordered at the surface in dilute solutions (XBZN < 0.4).45 Simulation suggests, this ordering arises from BZN stacking on the IL cation alkyl chain, while the C≡N group forms hydrogen bonds with imidazolium ring hydrogens at low XBZN (Fig. 6a, b and Supplementary Fig. S2-Aa–l). At low XBZN, each BZN primarily interacts with ion pairs, creating a more ordered BZN⋯IL structure in both bulk and surface regions. Supplementary Figures S2-Ag–l support the absence of a detectable C≡N peak up to 0.9 XBZN. The lack of vibrational signal of C≡N in SFG spectra for XBZN < 0.845 is due to H-bond confinement, while for XBZN > 0.8, excess BZN allows non-perturbed vibrational states.
The surface molecular structure, including orientation and relative positions, was studied by simulating slabs of each mixture under three-dimensional boundary conditions. Supplementary Figure S4 shows the number density of BZN, IL, cation, anion fragments and the entire system. Pure IL and BZN simulations were conducted for comparison. In the pure IL (Supplementary Fig. S5), cation is more exposed at the surface, a known phenomenon59. The butyl chain protrudes into the vapor phase, while the methyl group and imidazolium ring are beneath the surface, consistent with the SFG vibrational spectrum45, which shows no peaks from the methylene group or imidazolium ring. The number density for pure IL (plotted in Fig. 8) shows the outermost surface contains the butyl chain’s terminal methyl group, followed by methylene groups, the ring’s C atom, and the methyl group. This aligns with the SFG spectrum’s arrangement45, suggesting the imidazolium ring is parallel to the surface. Additional simulations show the ring has an extended density profile, mostly in the subsurface. These results suggest SFG arises from surface-exposed molecular moieties. Simulating the binary mixture clarifies how each component probes the other, resolving ambiguities about which regions generate the sum-frequency beam. Figure 8 also includes illustrations of molecular moieties at the surface, which may indicate regional origins of the SFG occurrence.


Number densities profile of C atoms of pure IL \(\:\left[\textC_4\textm\texti\textm\right][\textP\textF_6]\).
For 0.1 and 0.3XBZN mixtures (Supplementary Fig. S4b, c), BZN molecules primarily reside in the bulk phase due to frequent BZN⋯IL stacking (Fig. 7). The surface orientation of cations and anions mirrors that of pure IL. At 0.5XBZN (Fig. 9 and Supplementary Fig. S4d), both BZN and IL show increased surface densities, with higher BZN fractions preventing IL fragments from reaching the surface. At intermediate mole fractions, BZN and IL compete for the outermost surface, and their interactions affect susceptibilities and SFG activity. The SFG spectrum shows a gradual reduction in CH3 peaks near 0.5XBZN45. Figure 9 for 0.5XBZN reveals a crossing point in IL and BZN surface densities, smoothly extrapolating to zero. BZN increasingly dominates at the outermost surface, particularly near 0.5XBZN (Supplementary Figs. S4, S6), attributed to BZN stacking on the cation’s alkyl chain in the 1:1 mixture’s structural morphology.
Consistent with these findings, the SFG spectra indicate that BZN is more ordered at the interface45. In mixtures studied by simulations and SFG, there are either free (uncorrelated) alkyl terminal CH3 groups or free benzonitrile ring −CH (in mixtures with XBZN < 0.5 or XBZN > 0.5, respectively) available to generate and scatter the SFG beam. A closer look at the density profile (Fig. 9 and Supplementary Fig. S6) for other mole fractions (Supplementary Fig. S4) suggests that no significant correlation between BZN and IL occurs, particularly in the outermost region of the interface.


Local number densities of BZN and IL fragments for the mixture at 0.5\(\:X_\textB\textZ\textN\).
In line with these considerations, the square root of SFG radiation intensity (Fig. 3b of ref45) decreases with XBZN for the CH3 peak of IL and increases for the CH peak of BZN, reflecting their proportional relationship to the number of oscillators in specific vibrational modes. Supplementary Figures S4 and S6 show that the number of BZN molecules on the surface increases with XBZN. At around 0.5XBZN, the SFG intensities for CH3 and CH plateau, indicating both components are present on the surface and are correlated as discussed. RDF plots (Figs. 2 and 3) reveal strong interactions between anions, cations, and BZN, leading to the lowest free vibrational mode in the 0.5XBZN mixture. Morphological analysis of IL + BZN mixtures (Supplementary Fig. S7) shows that as BZN concentration increases (XBZN > 0.5), ILs migrate from the surface to form small aggregates in the bulk, BZN predominates on the outer surface, and low-energy BZN molecules move to the surface for thermodynamic stability. These factors contribute to higher SFG intensity for BZN. Additionally, IL-BZN stacking (Fig. 7) directs methylene groups toward interaction with BZN.
Inter-dynamic properties
The dynamic properties of BZN and IL in binary mixtures are investigated through simulations of transport properties, such as self-diffusion coefficients (Di), using mean square displacements (MSDs). The MSD-based diffusion coefficients for the mixtures are detailed in the Supplementary Materials. Figure 10 illustrates the diffusion coefficients of IL, BZN, cation, and anion components at varying XBZN. BZN consistently exhibits a higher diffusion coefficient than IL anion and cation across all mole fractions. The diffusion coefficients of cations and anions closely match those of IL, indicating strong cation-anion correlations. Diffusion coefficients vary systematically with mole fraction, with a significant shift in molecular transport around 0.5XBZN, paralleling changes in mass density and surface tension (Supplementary Fig. S9). The trends show that BZN’s higher diffusion coefficient increases the mixture’s overall diffusion. This introduces two rheological regimes: low XBZN (~ 0.1 to 0.3), where diffusion coefficients resemble those of pure IL, and high XBZN (~ 0.9), similar to pure BZN. Diffusion coefficients increase linearly up to 0.5XBZN before accelerating exponentially, highlighting the need for further investigation in ongoing research.


The concentration dependence of the calculated self-diffusion coefficient of the whole system, BZN, and IL fragments.
link